
The Only Three Indicators You Actually Need
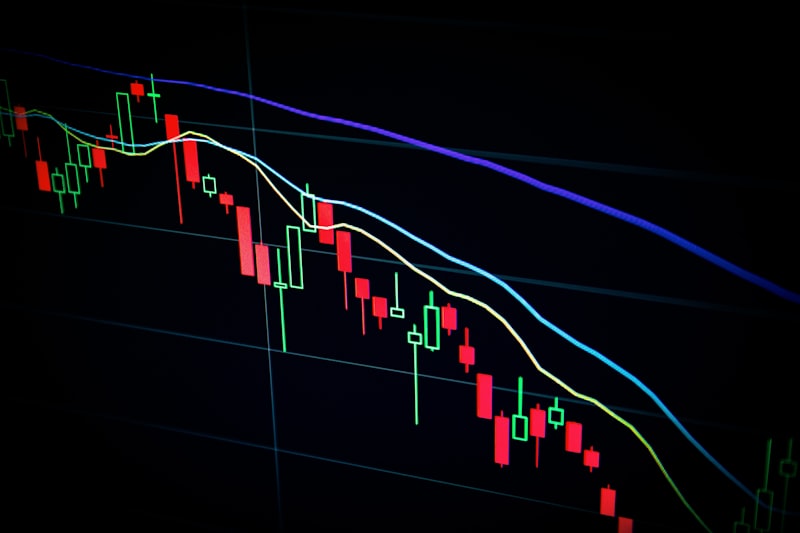
I’ve seen charts that make my head spin. Indicators on top of indicators, rainbow-colored clouds, and so many lines you can't even see the price.
Here is a secret: The more indicators you have, the more confused you will be. This is called "Analysis Paralysis." While you’re waiting for five different squiggly lines to align, the trade has already moved 50 pips without you.
If you want to trade like a professional, you only need three tools.
Pete's Rule: A chart is not a canvas for artwork. It is a dashboard for data. If an indicator does not directly help you answer the question 'Where is the liquidity?' or 'Who is in control?', delete it.
1. The 200-Period Simple Moving Average (SMA)
This is the "King of Indicators." Institutional traders, hedge funds, and bank desks all look at the 200 SMA.
It serves one purpose: The Trend Filter.
- If price is above the 200 SMA, the trend is bullish. You only look for buys.
- If price is below the 200 SMA, the trend is bearish. You only look for sells.
Don't overcomplicate it. If you're fighting the 200 SMA, you're fighting the big money.
2. Relative Strength Index (RSI)
Most people use the RSI wrong. They think if it's over 70, they should sell. This is a great way to lose money in a strong trend.
The professional way to use RSI is to look for Divergence.
- If price is making a "Higher High" but the RSI is making a "Lower High," the trend is losing steam.
- This is your warning sign that a reversal might be coming.
RSI isn't a "signal" to trade; it's a "thermometer" to check the market's health.
3. Volume Profile (or ATR)
Price alone doesn't tell the whole story. You need to know if the big players are participating.
- Volume Profile: Shows you WHERE the most trading happened. These are the levels where institutions have their "fair value" zones.
- ATR (Average True Range): If you can't access volume (like in Forex), use ATR to measure volatility. It tells you how much the market is moving on average, which is essential for setting your stop loss. This ties directly to our guide on Friday Trading Traps where clean analysis protects capital.
Why only three?
Because trading is about making decisions under pressure. If you have ten indicators, they will always contradict each other. One will say buy, another will say sell, and three will say wait.
With three clean tools, you have a clear "Yes" or "No" for every trade. Learn to build systematic indicators in our Structured Courses.
Pete's Minimalist Toolkit
Key Takeaways
- Strict Trend Alignment: Never take a contrarian trade against the daily 200 SMA trend line.
- RSI is for Divergence, Not Overbought: Do not blindly sell high RSI readings in trending markets.
- Keep Charts Clean: Complexity invites hesitation. Keep your toolkit strictly limited to three indicators.
Want to see these in action? Check out our Technical Analysis Guide for the full strategy.